On the difficulty of evaluating learning
And the major challenge of EdTech
This new #edtech app promises to finally teach you mathematics in a fun and effortless way. This expensive school program ensures that your daughter will be a successful and productive member of society. This Facebook article insists that your toddler should listen to Mozart all day long to unleash their full potential.
And there you are, logging into your favorite language learning app, earning your 200 experience points a day, sometimes even successfully ordering a pizza in Italy. But are you really learning anything?
For this article, I got my hands dirty and rigorously used such an app for about a year. I applied myself and, at the end of the year, received a nice praise: I am happy to report that I am a galactic legend in language learning, top 1% worldwide. While this flatters my ego, truth be told, my actual language skills did not improve significantly. Why is that?
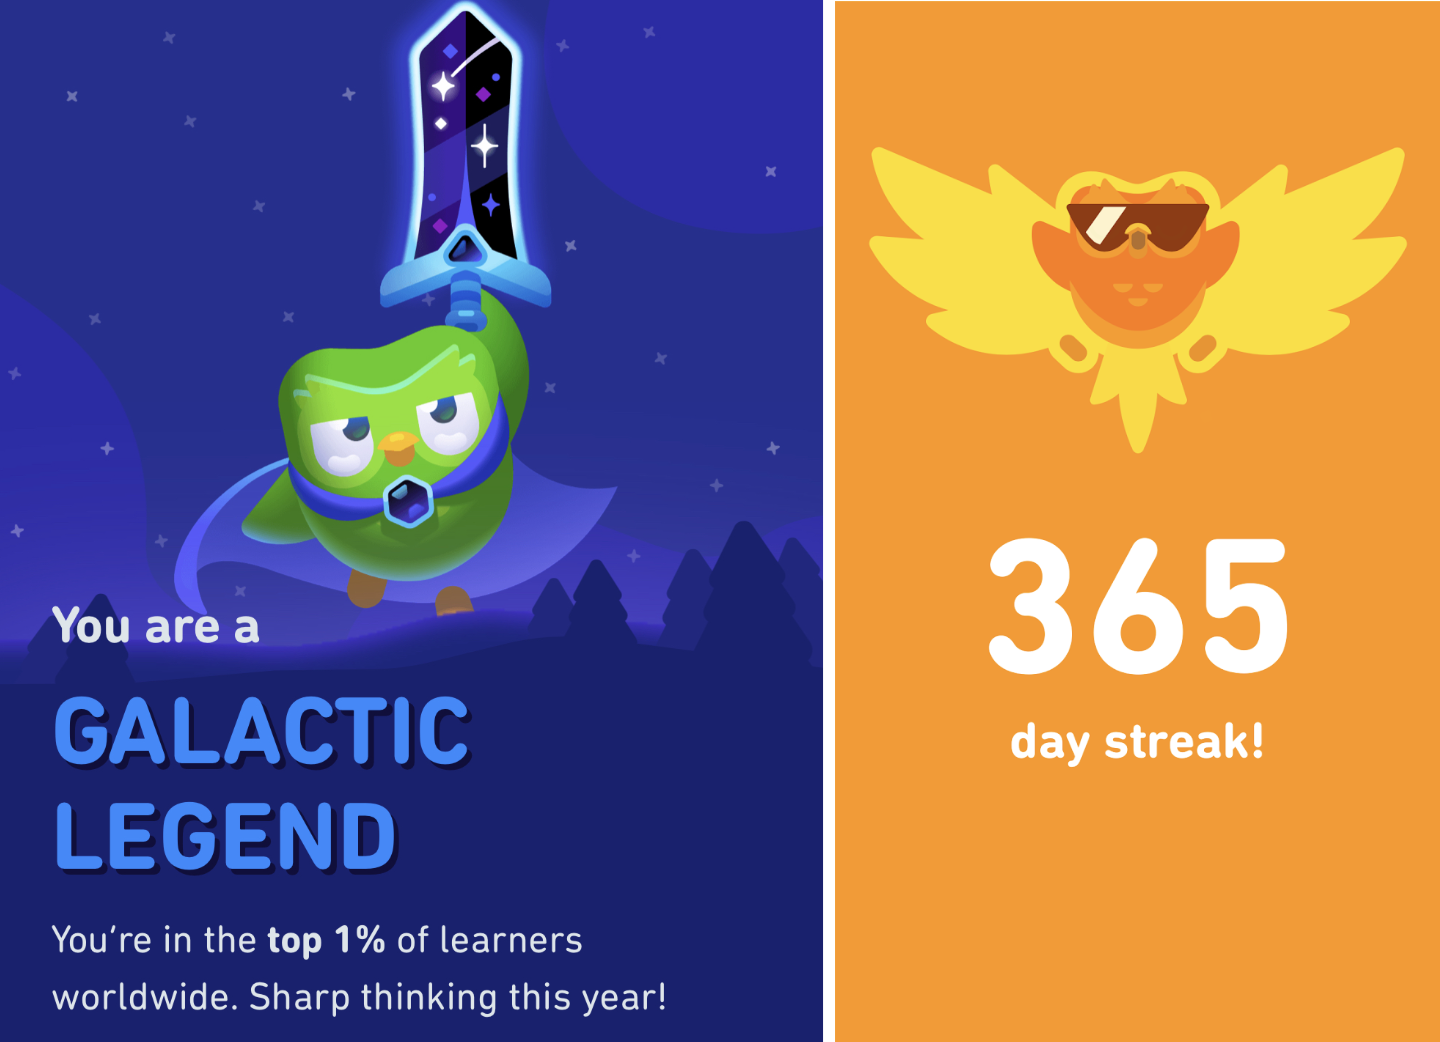
I’m a galactic legend.
Many companies or programs claiming to magically teach you “all the things” in a “fun” and “effortless” way are, most times, not actually evaluating whether or not their approach works. And when they do, it is often poorly done.
Now, can we blame them? Maybe a little. That being said, how can one actually evaluate learning? Today, let’s take a dive into the work of a learning scientist! Imagine that you built this cool revolutionary math learning app, and you want to know whether it actually helps people learn anything. As you go on this journey, you may commit several mistakes. Let’s debunk the main ones.
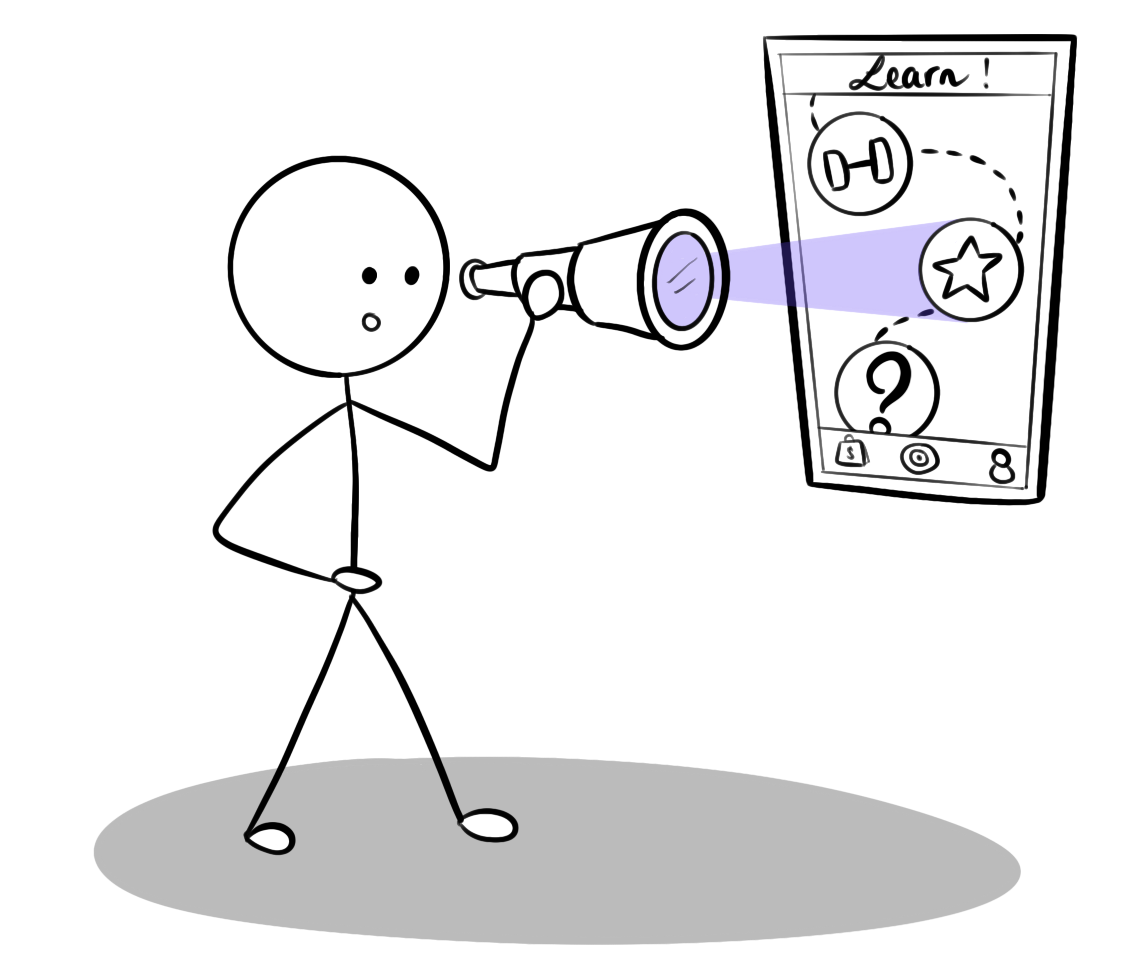
Representation of a learning scientist learning sciencing.
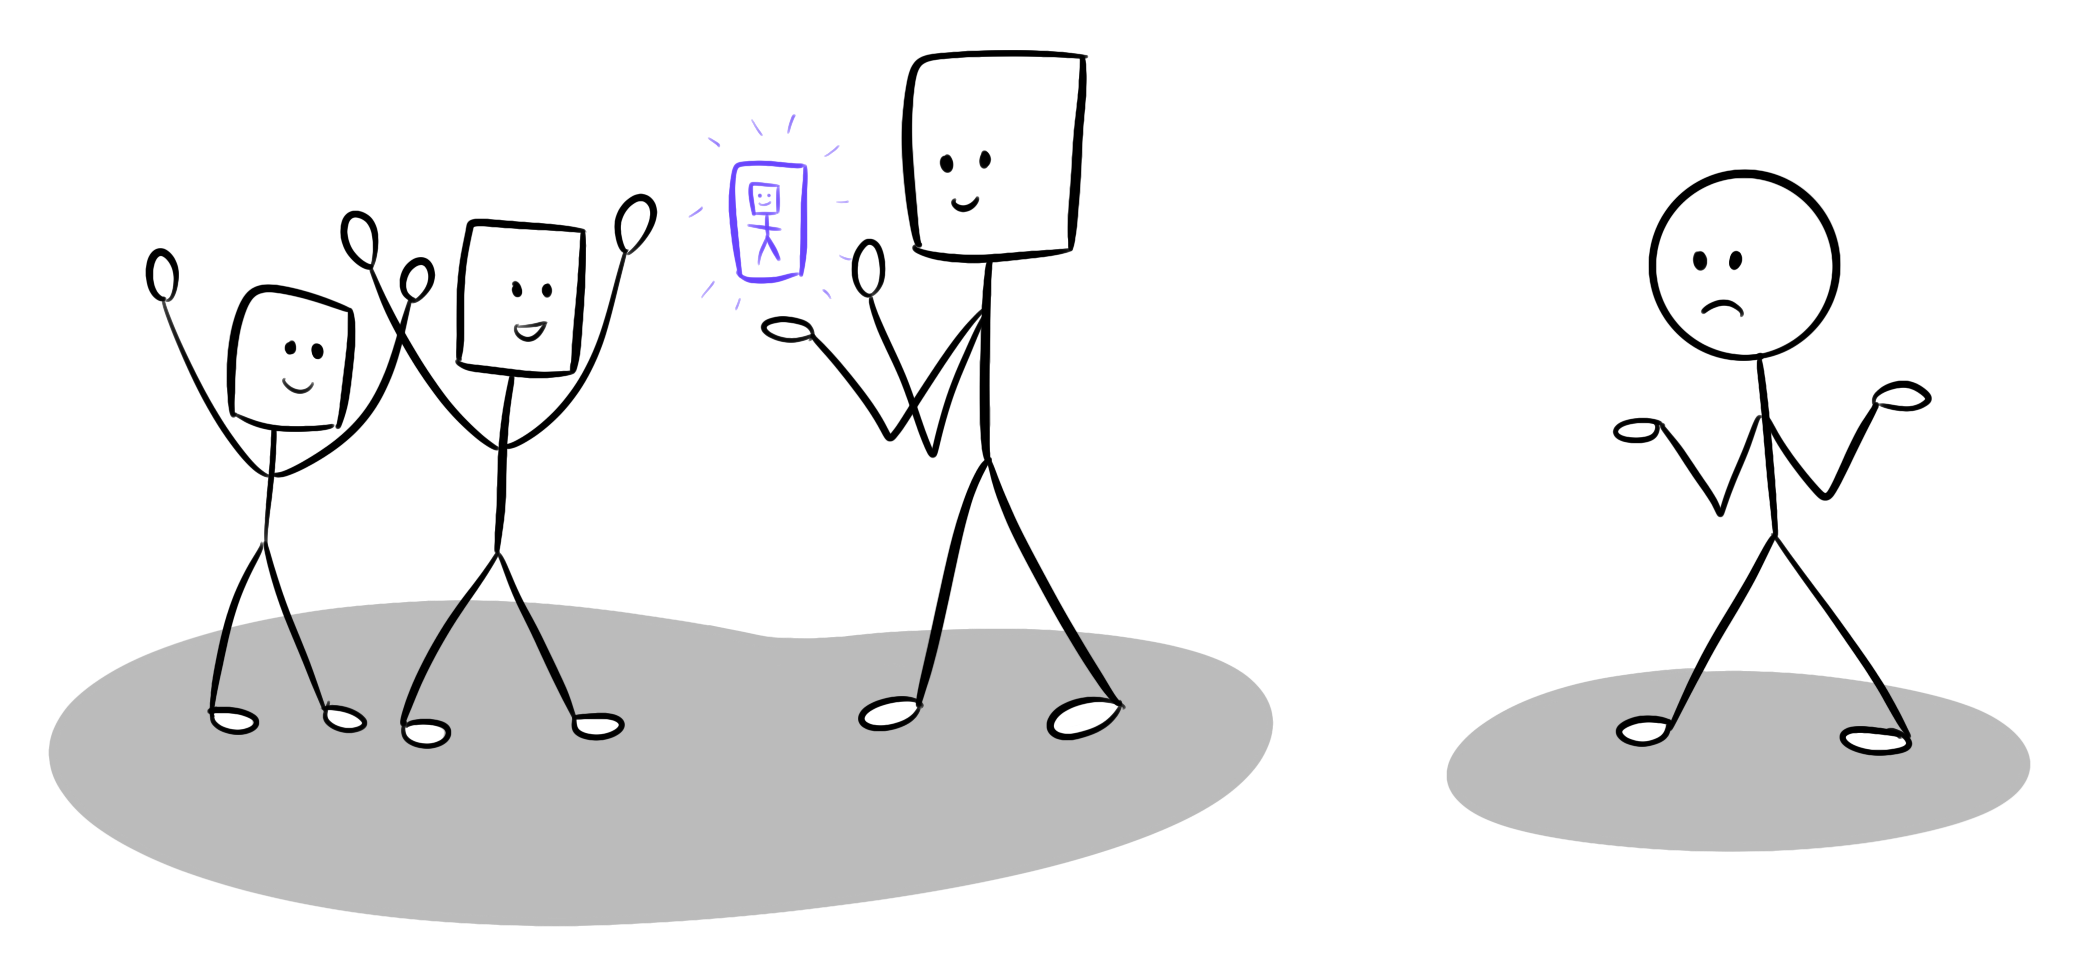
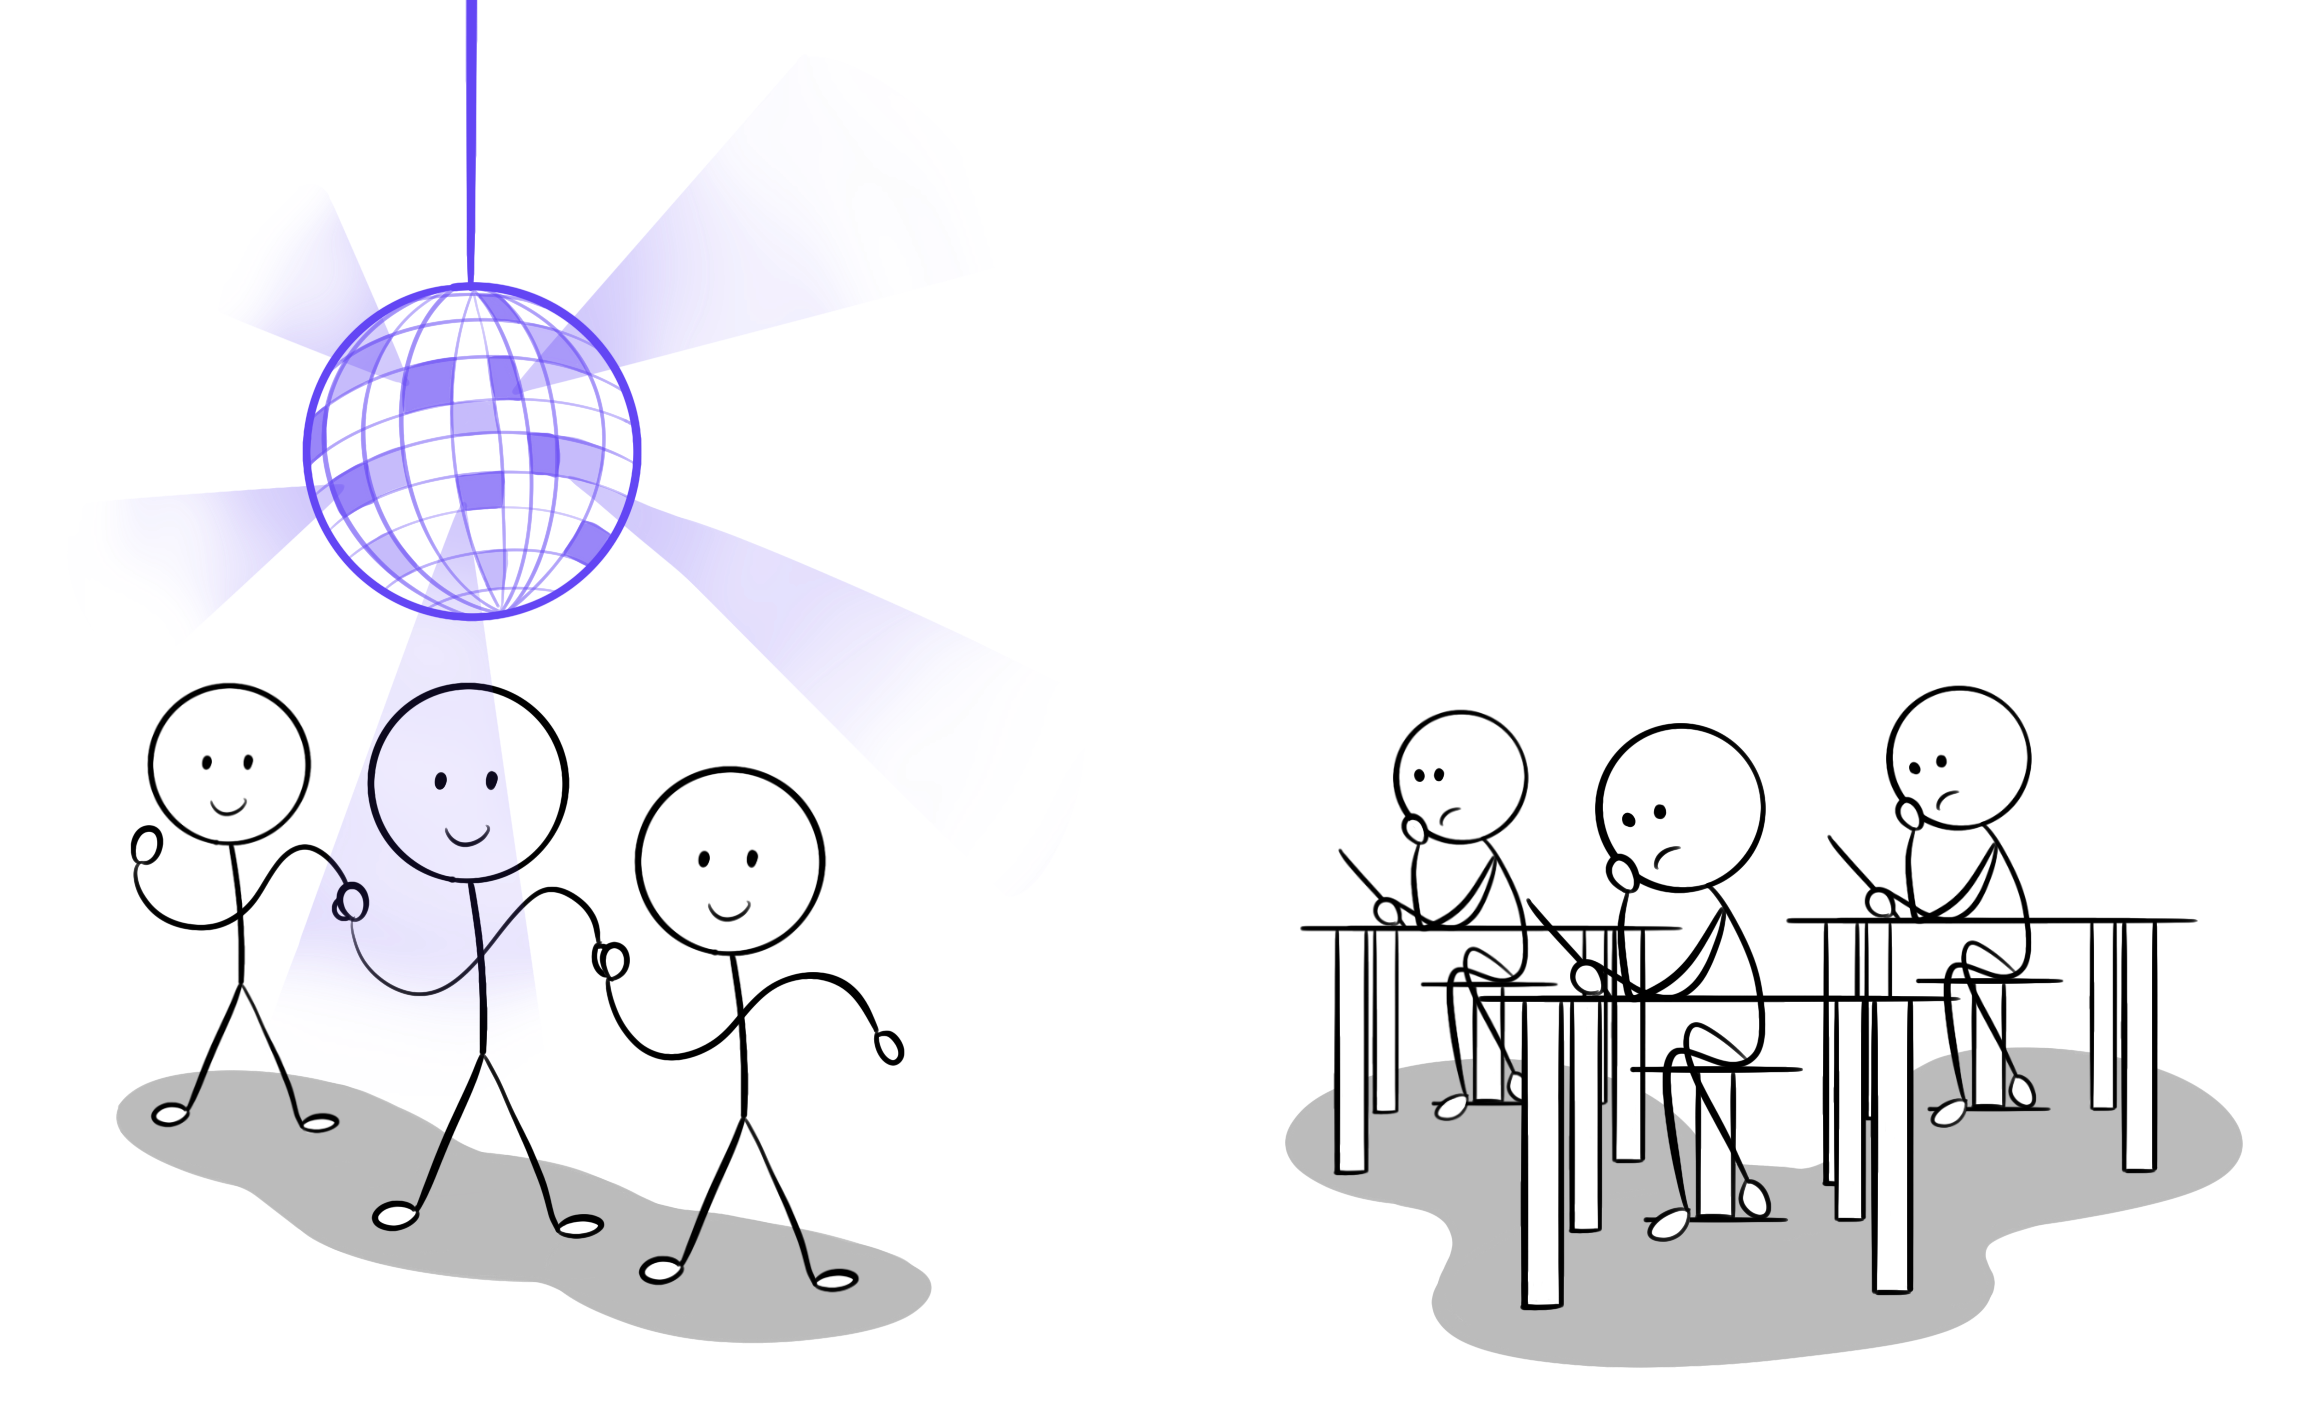
First mistake: Test the app with your colleagues
Your app is ready! You want to try it out, so you decide to send it to your colleagues, and ask them to try it out with their children. Your colleagues report that their children loved it and learned a lot. You are happy: your app is a hit!
Here, the issue is quite obvious: by focusing on testing within your community, you are exposing yourself to bias and lack of diversity in the testing population. Most likely, your colleagues love math as much as you do, that’s why they work in your team. And they probably also shared their passion with their children. So the only thing you proved is that children growing in math-friendly environments loved your math app. Interesting, but definitely not enough.
Fix: As soon as possible, try your app with target users. Focus on diversity.
This testing session went great, all the participants loved it!
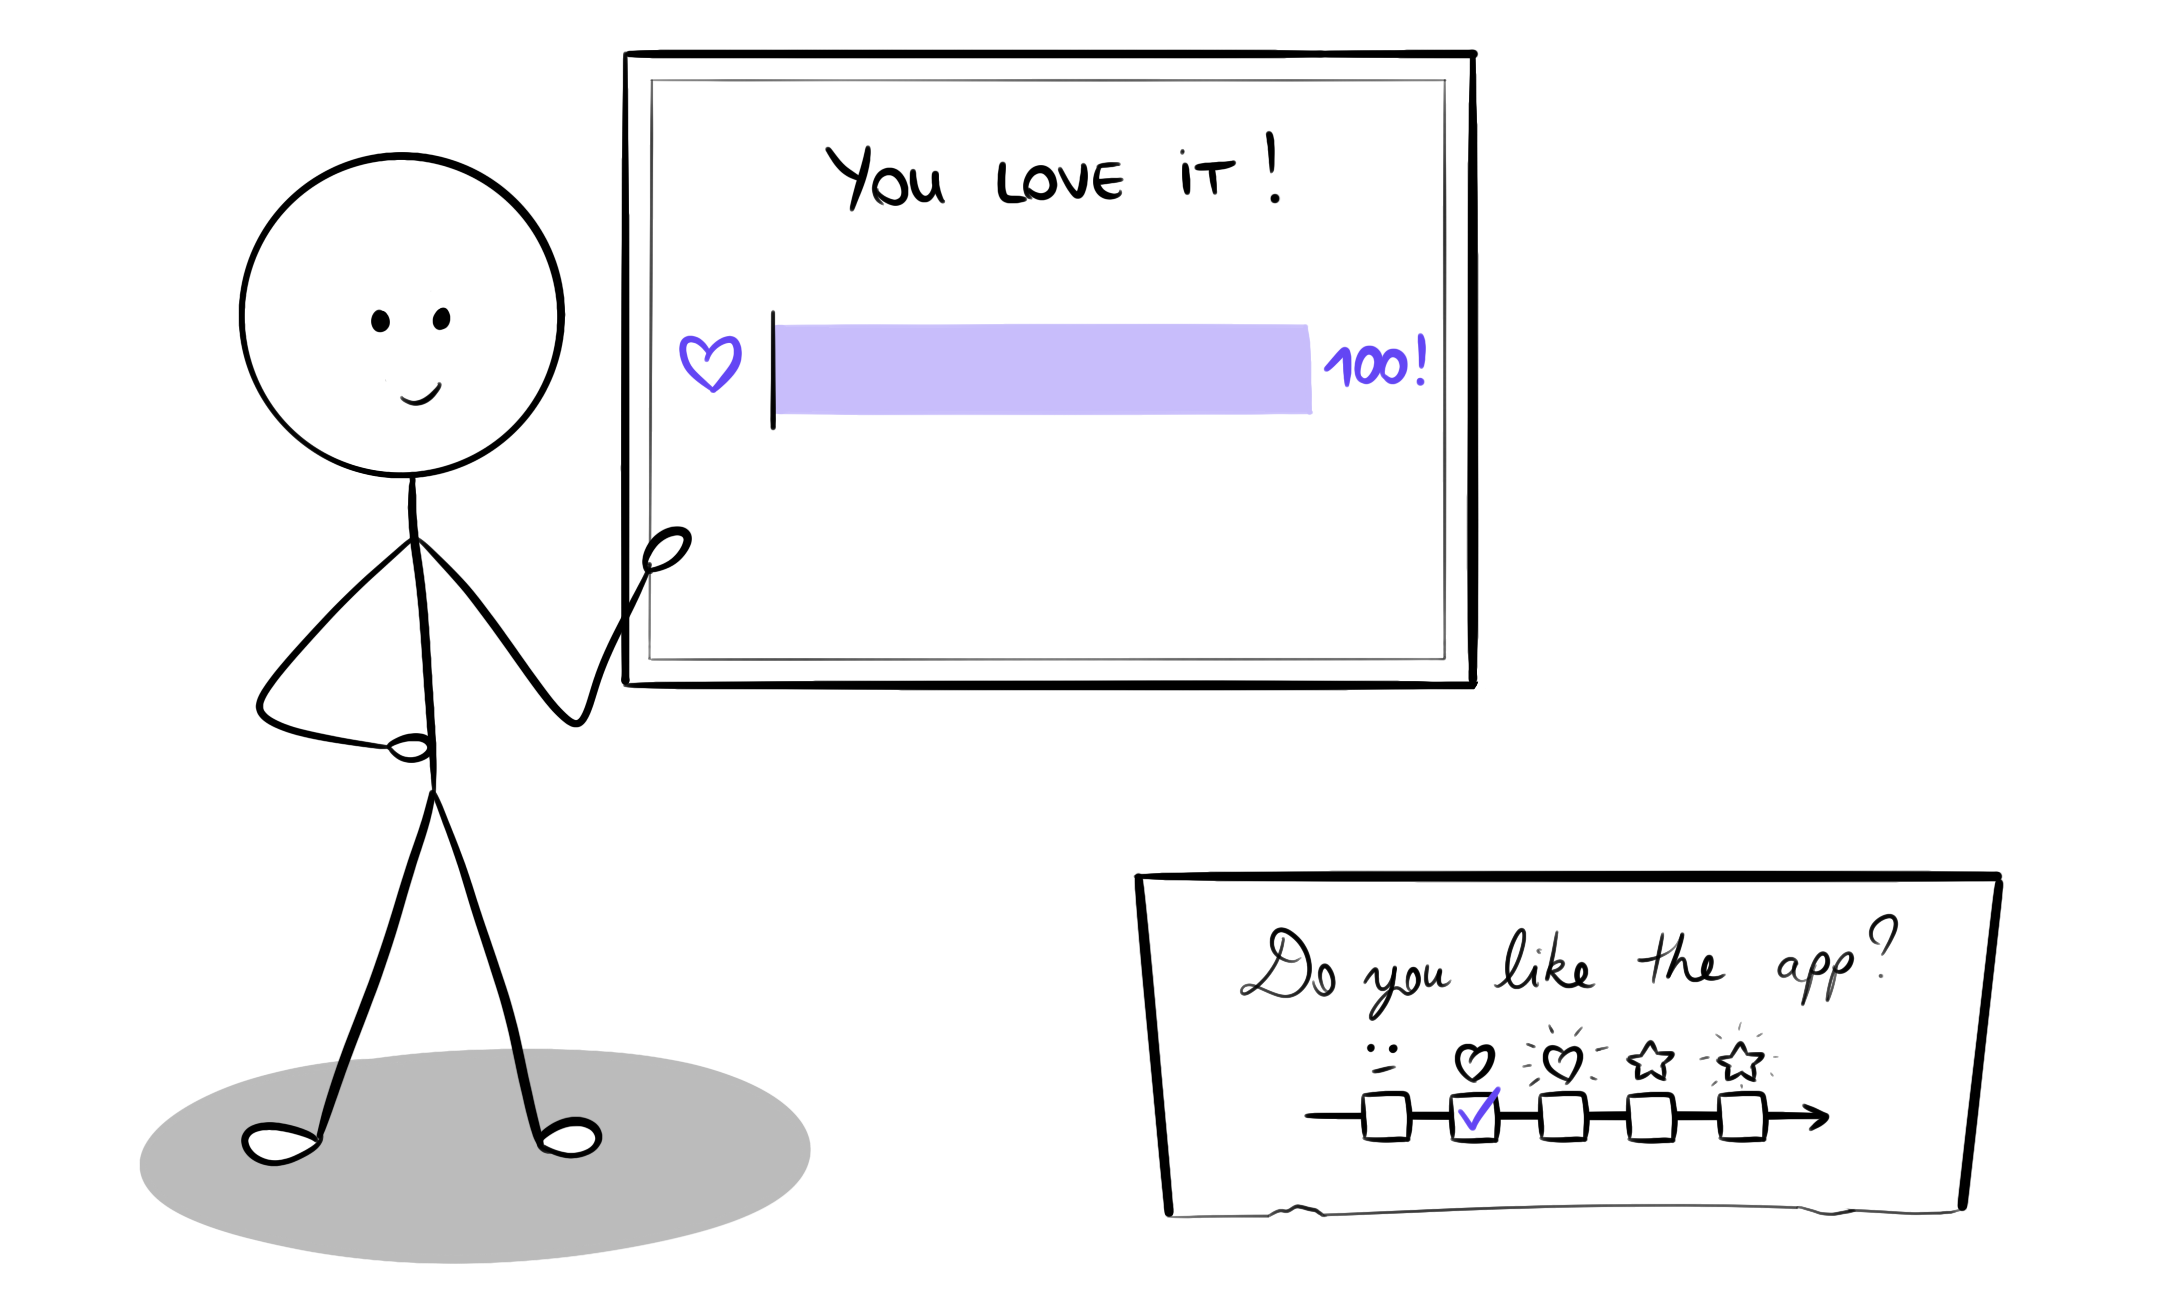
Second mistake: Focus on the performance after using the app
You recruited participants and now you ask them to use the app for an hour, and then you give them a little math questionnaire. On average, they scored 90% on the test! Fantastic, your app turns people into math geniuses!
Here, there are two main issues. First, is it really your app that is helping them learn? Or is it just the simple action of interacting with mathematics for a whole hour that helps people? To make sure that your app is really the important factor here, you should compare it to a baseline. For example, have half of the participants do math exercises on paper during the same hour, and compare their results at the end. We usually call this A/B testing.
But there is another issue: by testing learning only after using the app, you don’t see how much students have improved. Maybe you got unlucky, and all your participants were already math savvy and would have scored 90% anyway. To solve this issue, we usually also test for ability before any intervention (using a so-called “pre-test”), and focus on progress (difference between post-test and pre-test) rather than scores.
Fix: Compare your app to a baseline and focus on progress rather than score.
Look how great our app is! Learners have very high scores after using the app!
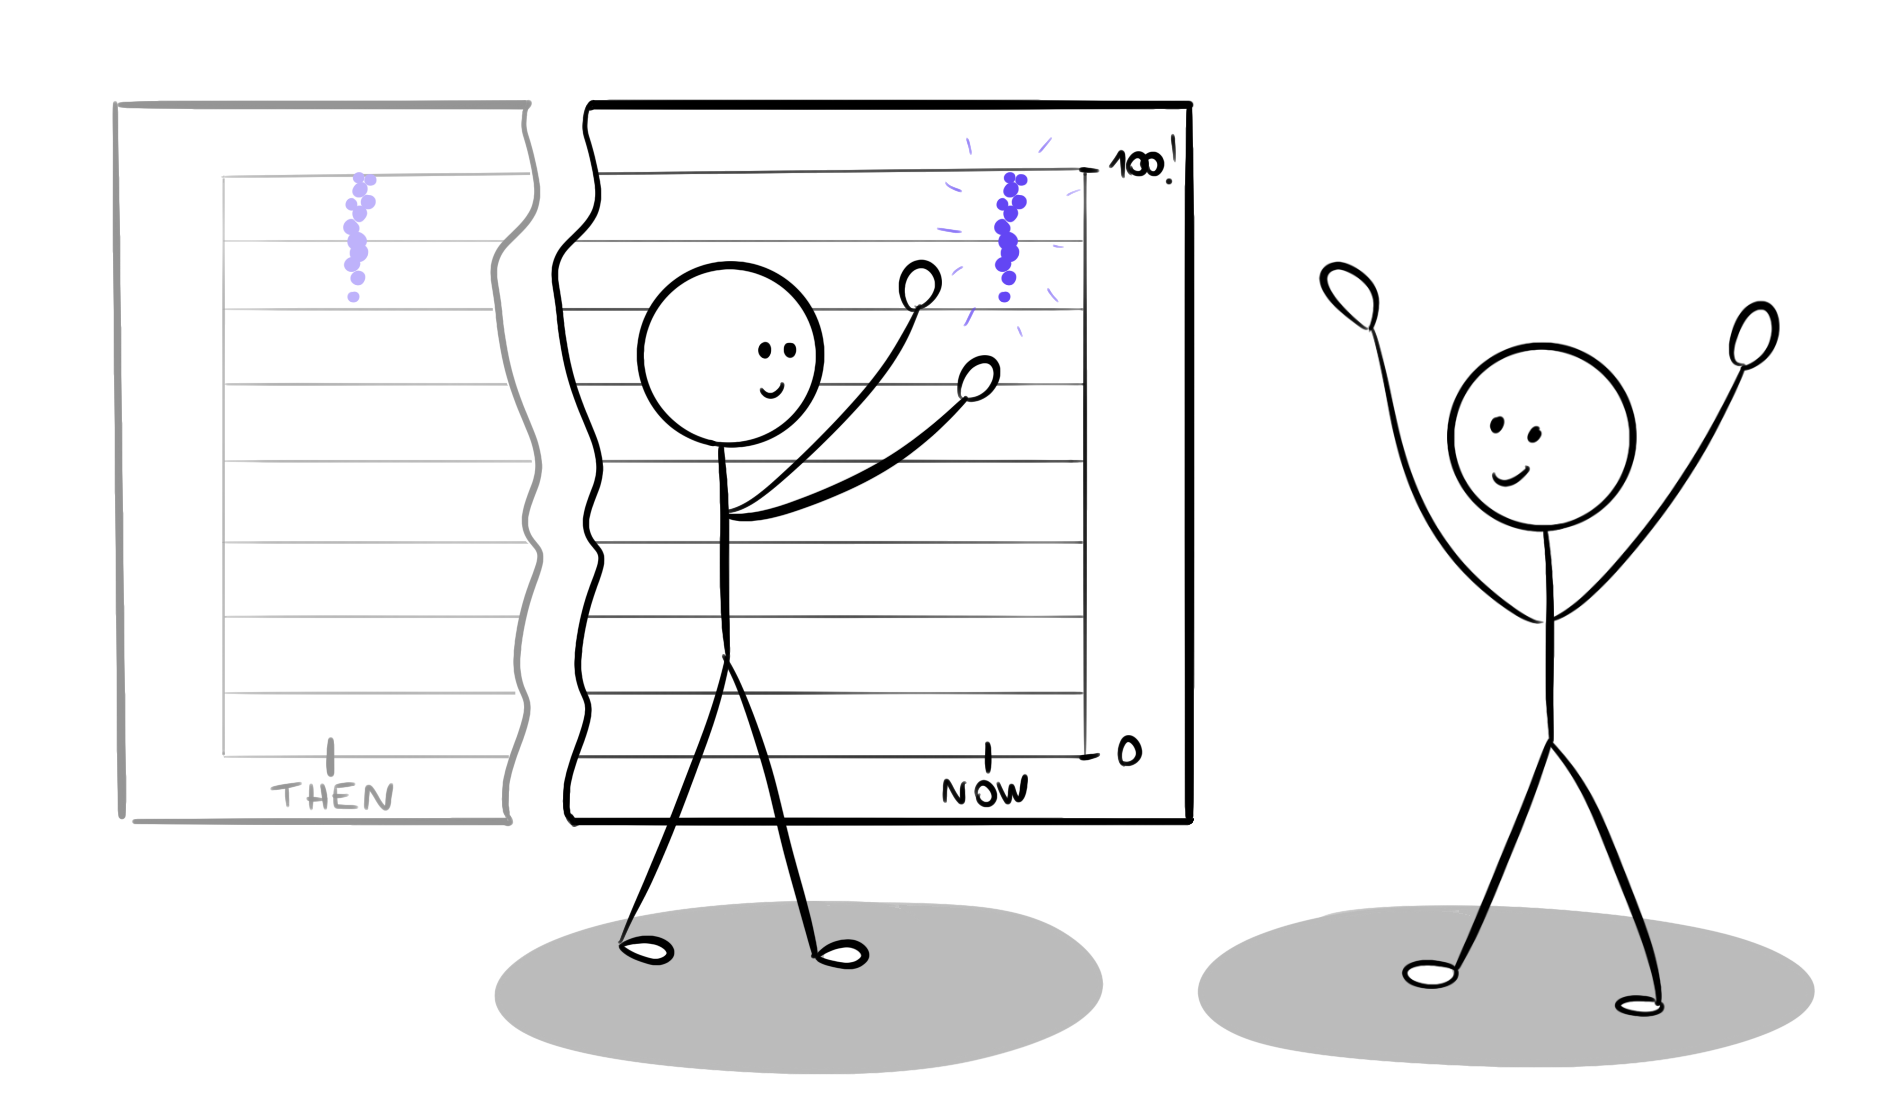
Third mistake: Test the app once
Now, you go to classrooms, and give half of the students a video about math, and the other half gets your app. After one hour of practice, students using your app improved their math grade by 2 points, while the students using video only improved by 1 point. Excellent! Your app is better than videos for learning math!
Once again, maybe not… Let’s say videos are the usual way students learn math in class, while your app is a shiny new thing students have never seen before. Students using your app are likely to be much more invested in trying out the app and focusing on the content as it’s new and exciting. In contrast, the students on the video might feel bored doing something they already do all the time, and even a bit disappointed to not be in the group doing the exciting stuff, so they will not pay as much attention to the activity. This effect is called the “novelty effect” and is particularly important when you work with new technology, for example Virtual and Augmented Reality.
Fix: Test several times over an extended period of time.
Are people liking your activity, or are they just excited about trying something new?
Fourth mistake: Use biased instruments
We are getting there! Now it’s time to focus on the instruments used to gather user feedback. Often, you will have to design your own questionnaires, as standardized questionnaires might not cover your specific use case.
And here, we have to be careful. Although you might be excited to show your app in a good light, if you truly care about impact, you need to make sure that your instruments are not biased. There are a few rules here that you can follow. For example, do not only include positive questions and statements, such as “I found the app exciting!”, but also negative counterparts, such as “I found the app boring!”. Moreover, center your scales on a neutral value, so that you have the same amount of positive and negative answers. And if you are not sure whether or not your questionnaire is biased, it can always help to get it validated by a third party who is not involved in your project.
Fix: Use standardized or unbiased and validated instruments.
It’s good to be excited about your product, but it may induce bias.
> the extra bit_
Let's talk about the myth of effortless learning.
While many companies are trying to sell “effortless learning” tools, I would like to insist that learning is never effortless. What might differ is how much you enjoy the process. People often refer to game-based learning as the holy grail of effortless learning. You play Assassin’s Creed and magically get infused with knowledge about Ancient Rome history. Calling this process effortless would be quite naive. As a player, you spend hours and hours making sense of the map and the story, failing mission after mission until you successfully connect the different pieces and, to some extent, learn. You did enjoy the process, but it came with effort, frustration, and exploration. This is what learning is all about.
That being said, not all effort results in learning. There is a whole field of research looking into “desirable difficulties”, difficulties that are actually helpful for learning. For example, in some of my work, I looked into how reducing the usability of a tool and the smoothness of interaction can actually help students learn as it invites them to deliberately think about their actions. However, unusable tools in general are not helpful for learning. Identifying what difficulties and what effort is helpful to learning is what we should really focus on.
> the extra bit_over_
Fifth mistake: Focus on significant differences
Now let’s say you have a good study design. For example, you compare learning outcomes of a group of students using our app to a group of students watching videos on the same topic, over a year. And you find a difference: people using your app learned more than those watching the videos!
This is starting to look good, you are definitely on the right track. But there is a bit more to it. I will not go into all the technical details here, just give you some pointers for the general ideas. There will be some resources for the math of it all below if you are interested. I will just try to provide the right intuition on how to think about this. The first thing you need to do when comparing the app’s score to the videos’ score is to assess how likely it is that your results are due to chance, rather than highlighting an actual difference. To do so, you can use something called “Null Hypothesis Significance Testing”. What this tells you is that, yes, your app is better than the videos, it’s not just luck from participant recruitment or such. In that case, we usually say that the app performs “significantly” better.
Unfortunately, too often, the analysis stops there. However, there is something else to look into! For example, let’s say you find that using the app 2 hours per day for a month significantly increases your grade in math. This sounds exciting! But what if the increase is 0.01 point, out of 10. Is it worth it? Is it still that exciting? The measure of this difference is called “effect size” and is quite important as well.
Fix: Look into how major the differences are.
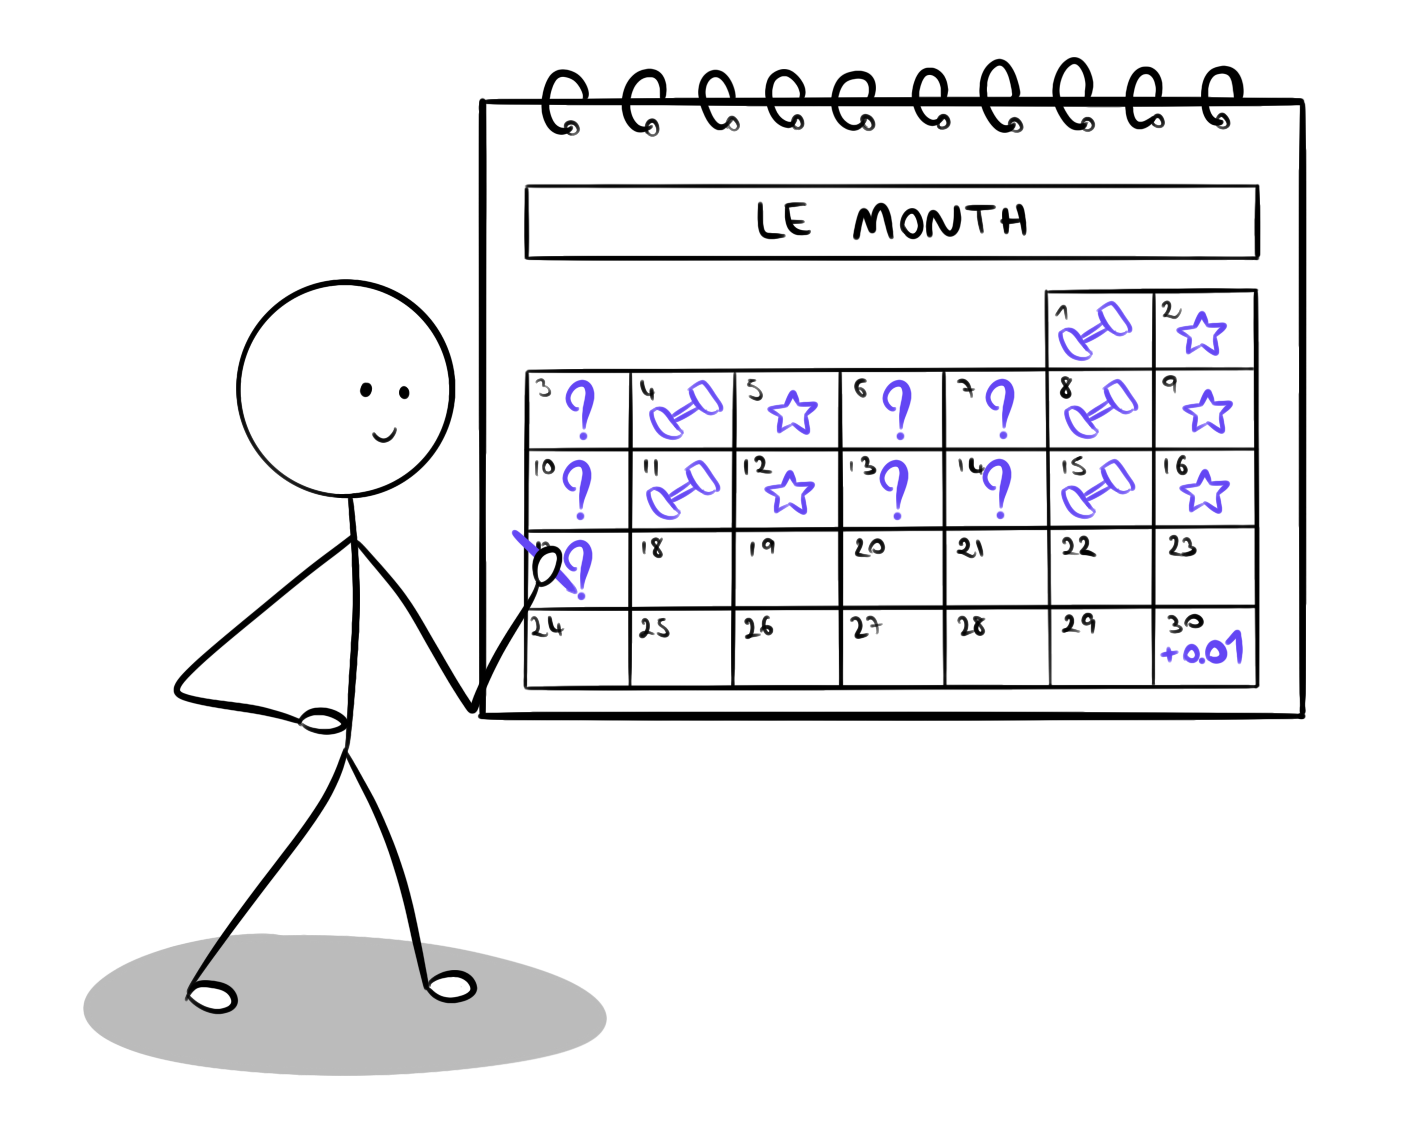
John has been using the app for a year now, unfortunately his learning is only 0.01%.
Sixth mistake: Rely either on quantitative or on qualitative data alone
We are getting there! After several studies, your app scores 7/10 on the instruments, and the videos score significantly lower, with a large effect size 5/10!
While this is very important and useful, as a developer of such learning tools, I often find that it is still not enough. It is interesting to know that the app performs better than videos, but why does it perform better? What did students like about it, what did they not like about it? How did they use it, how would they like to use it? Personally, I enjoy using “mixed-methods” approaches that use both quantitative data (numbers, measurable things), and qualitative data (feedback, interviews, unmeasurable things). There are two ways in which you can do that.
You can start by a quantitative study, figure out that your app gets a score of 7/10, and continue with a qualitative study where you interview different users and ask them why they gave such scores, and other questions of interest. Another approach is to start with an interview to get an understanding of what is important to explore. For example, you may learn that some students love having a timer on quizzes in the app, while other students find it stressful. And then continue with quantitatively exploring this by asking users to give a score for their stress levels while answering timed questions.
Fix: Use both quantitative and qualitative data: Rather than just “how much?”, also look into “how?” and “why?”.
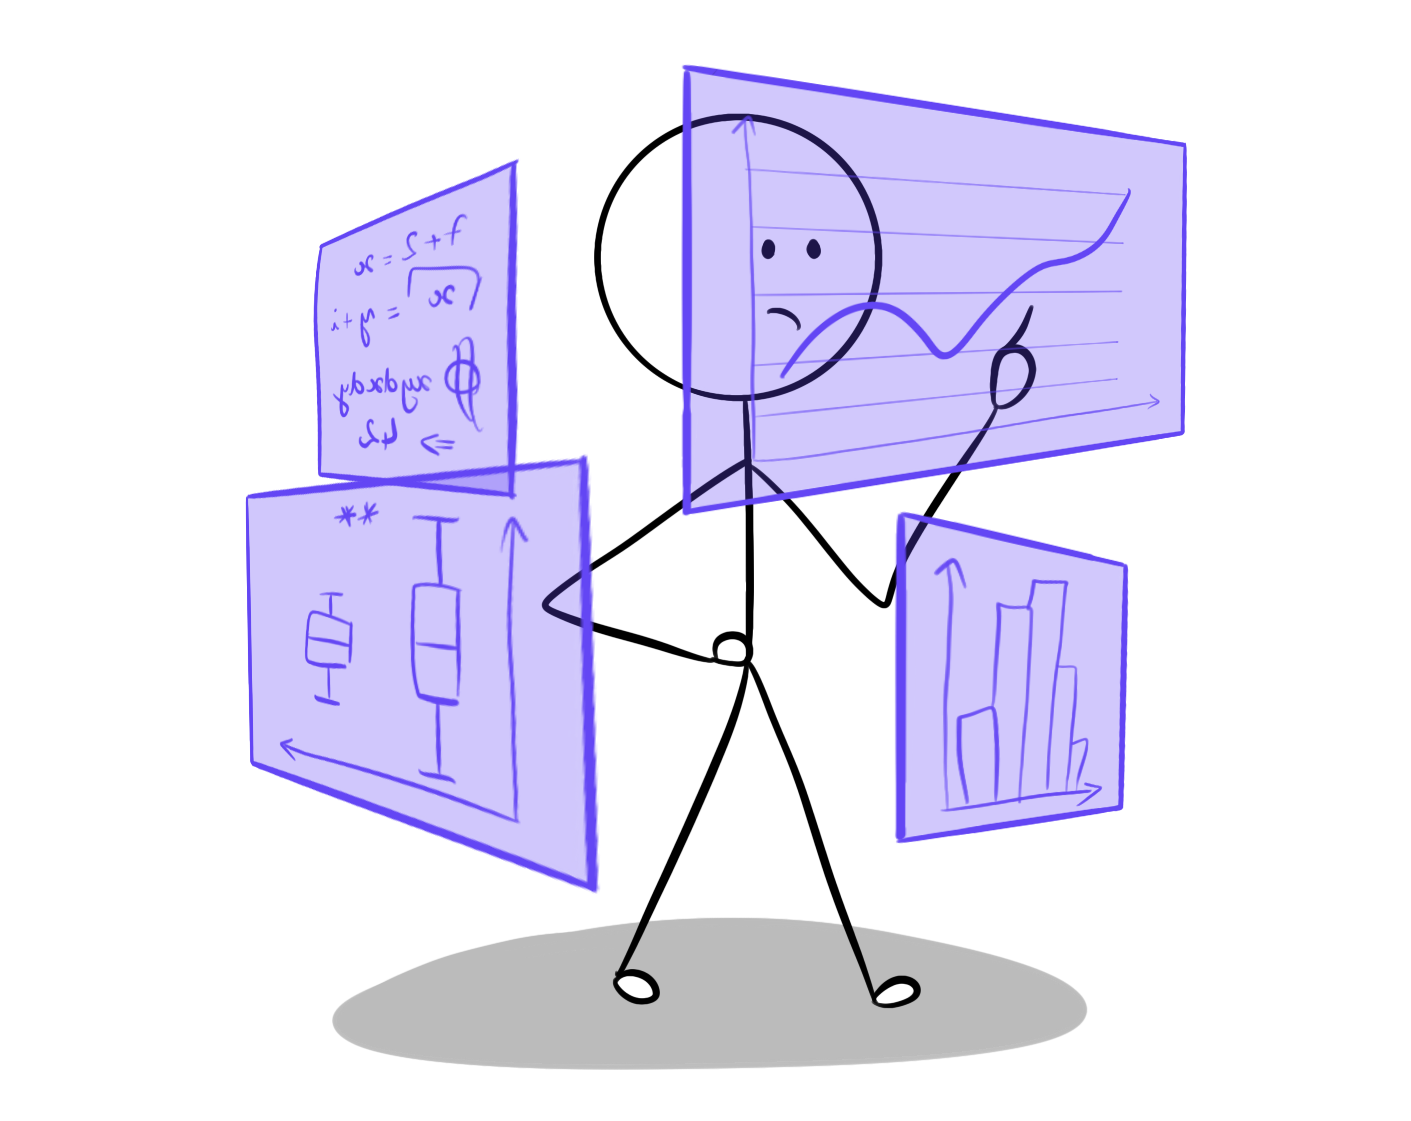
Paula is trying to make sense of all the numbers, but directly asking the learners would give her interesting insights that the numbers can’t show.
Seventh mistake: Ignore ethical concerns
At this point, we talked a lot about how to design a study to evaluate learning. But there is still one big question left: Is this ethical? One major issue with such studies is that if one activity outperforms the other, this also means that a whole group of students missed out on the opportunity to learn.
To make the importance of this question more salient, we can imagine a similar study in medicine. Let’s say that you want to evaluate whether your new medicine can treat cancer, and compare two groups: one using your drug, one using a placebo. While such study provides valuable insights, if the drug does work, the placebo group might have lost valuable time and opportunity to heal.
Going back to learning, if a government were to impose a new education system on half of the country, we would be at risk of impairing learning for millions of students, and potentially robbing them of career opportunities.
Another question is: Is this study worth people’s time? When I was in college, together with a bunch of friends, we decided to build an automated tool to translate spoken French to French Sign Language. As I wanted to best understand the needs of people with hearing impairments, I contacted different associations to conduct interviews and get some insights on how to better design such tools. And one of the people I interviewed said something that I will never forget: “You know, people keep coming to us to test prototypes and ask questions, and they publish papers, they get grants, and we give our time, but this never comes back to us. This work is actually never used to make our lives better.” So, how do you give back to the people who are spending time helping you with testing your product?
Fix: Get your study approved by an ethics commission. Give back to people.
People are kind, and may actually join, but should we systemize this?
And there we are! We now have all the tools necessary to evaluate our learning activities! This may seem like a lot, but don’t be discouraged. Even if you cannot follow all these points, any step you take in the direction of actually evaluating learning is extremely important. For a long time, this kind of work was hardly rewarded by investors and customers, making it even more difficult for EdTech start-ups to dedicate time and energy to thoroughly evaluating their products. Fortunately, we noticed a shift in perspective in recent years, giving true value to learning evaluations. Going in this direction, I hope that this article was useful to give you an initial toolkit to evaluate your project and make sure your learners don’t end up spending a whole year learning nothing much!
xoxo,
The Diverter
To go further:
An article about the problem: Williams, T. (2023) Edtech firms ‘lack evidence’ to prove products’ impact – Unesco Studies claiming how technology can ‘transform’ educational systems require more academic rigour, finds new report (link)
Learn about Null Hypothesis Significance Testing: (link)
You can also check out this book, it has everything you need (TW dark humor): Field, A., Miles, J., & Field, Z. (2012). Discovering statistics using R (Vol. 3). London: Sage.
Alternative approach to data analysis (that I like a bit better), Bayesian analysis: Faulkenberry, T. J., Ly, A., & Wagenmakers, E. J. (2020). Bayesian inference in numerical cognition: A tutorial using JASP. Journal of Numerical Cognition, 6(2), 231-259. (link)
Learn about desirable difficulties in general: Bjork, E. L., & Bjork, R. A. (2011). Making things hard on yourself, but in a good way: Creating desirable difficulties to enhance learning. Psychology and the real world: Essays illustrating fundamental contributions to society, 2(59-68). (link)
Learn about an example of desirable difficulty in interaction: Chatain, J., Ramp, V., Gashaj, V., Fayolle, V., Kapur, M., Sumner, R. W., & Magnenat, S. (2022, June). Grasping Derivatives: Teaching Mathematics through Embodied Interactions using Tablets and Virtual Reality. In Interaction Design and Children (pp. 98-108). (link)
Learn about mixed-methods in research: Dingyloudi, F., & Strijbos, J. W. (2018). Mixed methods research as a pragmatic toolkit: Understanding versus fixing complexity in the learning sciences. In International handbook of the learning sciences (pp. 444-454). Routledge. (link)